STAR-CCM+ Prediction of the DLR-F11 Wing-Body High-Lift Test Case
Introduction
The High lift prediction workshop was held by NASA and the AIAA to assess and compare the capabilities of the CFD codes/technologies available at the time. The geometry, flow conditions, grids/meshes and experimental wind tunnel data are still available for download.
The aim of this study was to download and process the geometry, set up two test cases in STAR-CCM+ and assess the capability of two RANS turbulence modelling approaches (k-Epsilon and Spalart-Allmaras) for two angles of attack (7 and 18.5 degrees).
Rather than using one of the provided grids, a custom grid was generated. This was limited to 3 million cells, due to limited compute capacity. This presented an additional challenge, trying to include mesh refinement on critical areas such as the leading edge, while not sacrificing resolution in the wake region.
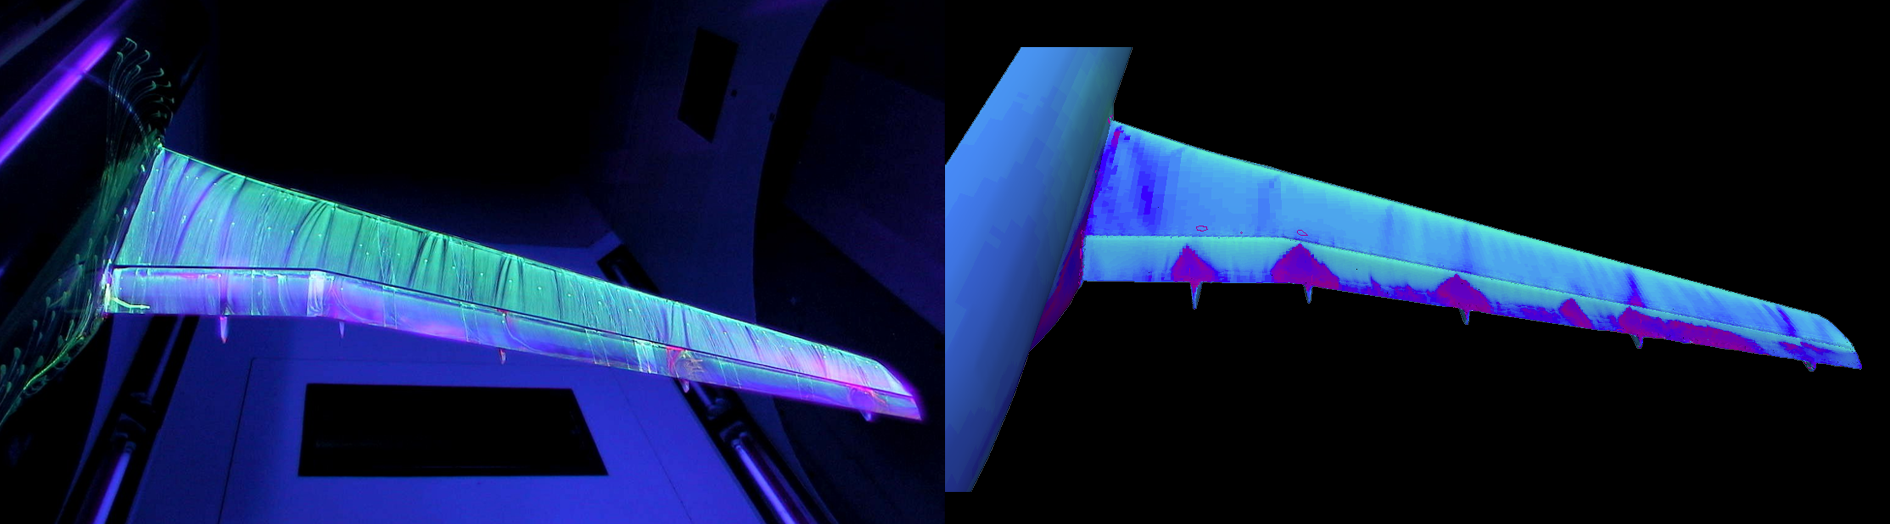
The DLR F11 is a semi-span model representative of a wide-body commercial airliner without engines; to avoid the complexity of the interface between wing mounted engines and nacelles on the lifting devices. The model has a deployed leading-edge Slat and a trailing edge Fowley Flap, the Slats are attached to the wing using 7 slat tracks and the flaps are attacked with 5 flap tracks (covered by fairings). For wind tunnel experimentation the model is mounted on a Peniche. The experimental wind tunnel data used for validation in this report was taken in the low speed wind tunnel of Airbus-Deutschland, B-LSWT, under low Reynolds number conditions.
CFD model setup
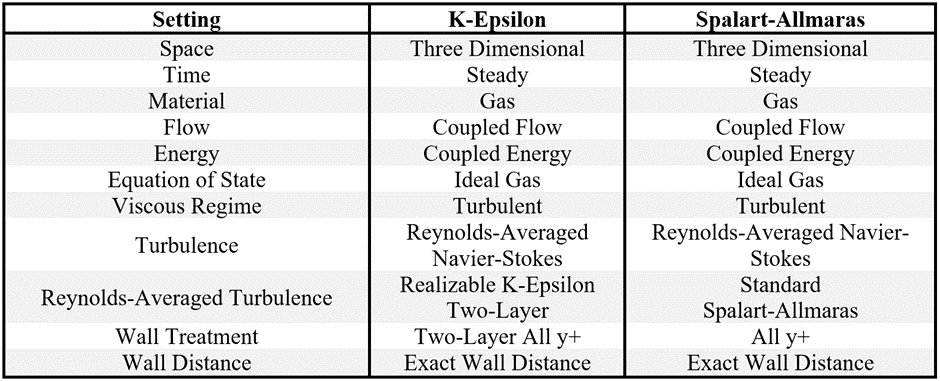
The flow conditions were matched to the wind tunnel conditions, ensuring the CFD model's freestream flow had the correct mach number, viscosity and density. The main physics models used for the viscous calculations are outlined below:
Results
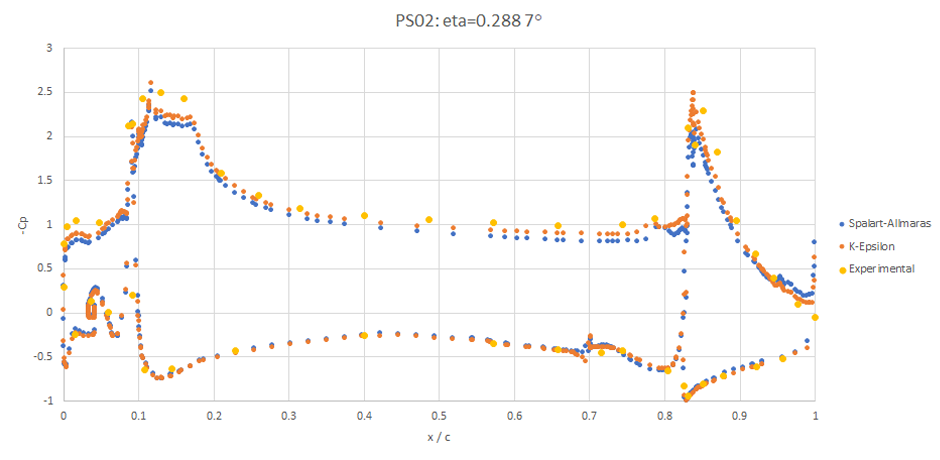
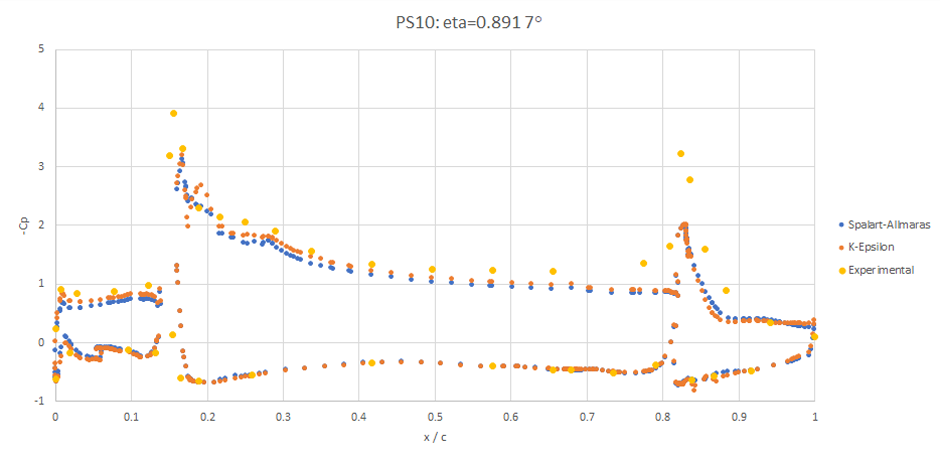
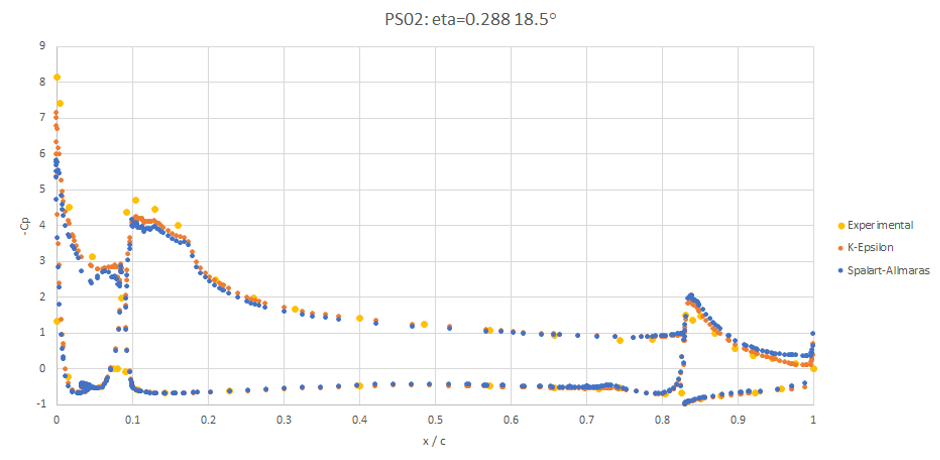
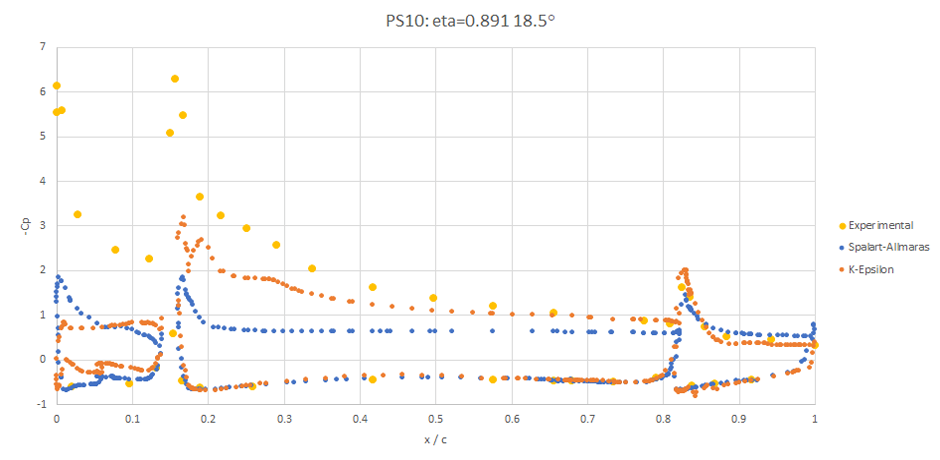
Both turbulence models performed reasonably well for the 7 degree AoA condition, however, both models incorrectly predicted large separated region at the wing outboard for the 18.5 degree AoA condition. The key methods of validation were comparisons of force coefficients and correlation to static pressure measured on the wing during the experimental testing.
The Lift force was largely under-predicted in all cases, especially in the 18.5 degree case were separation was predicted towards the outboard.
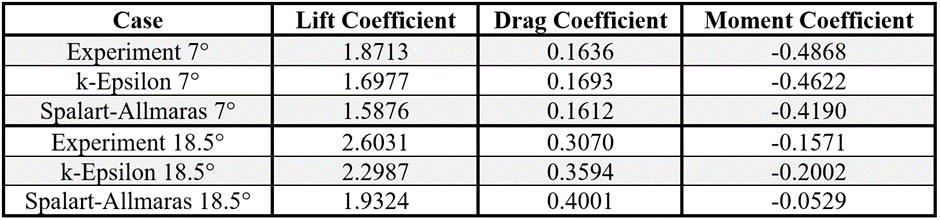
Plots of static pressure coefficient over the wing indicate regions attributed to the under-prediction of lift. The pressure distribution over the inboard wing section correlated relatively well to experimental data, in both the 7 degree and 18.5 degree AoA cases.
In the 7 degree case, at the wing outboard location, the suction peak on the mainplane was under-predicted and the flaps experienced flow separation. This contributed to the reduced lift when compared experiment.
In the 18.5 degree case, at the wing outboard location, both turbulence models predict massive separated regions over the entire wing, leading to a huge loss of lift and increase in drag.
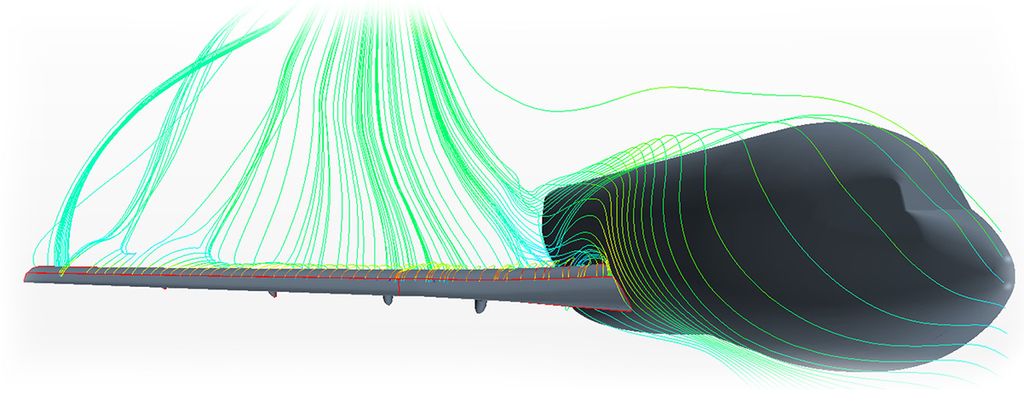
Finally, flow visualisation is presented to show the separated regions seen in the pressure distributions.
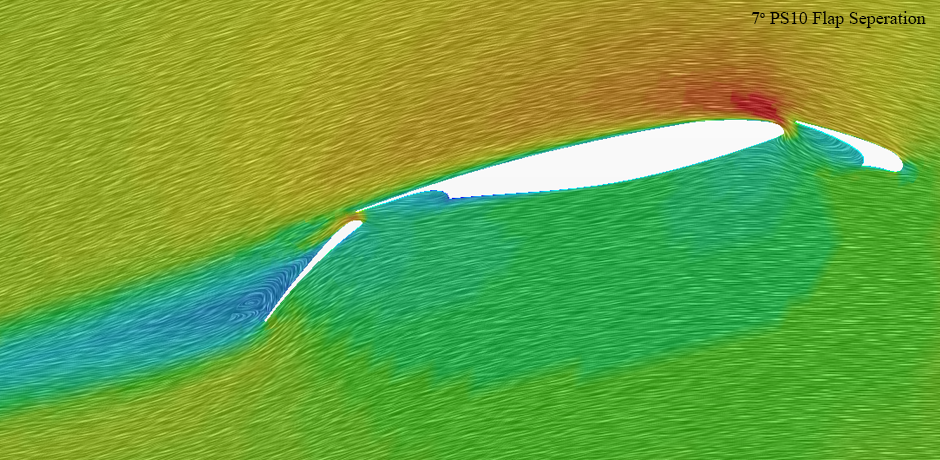
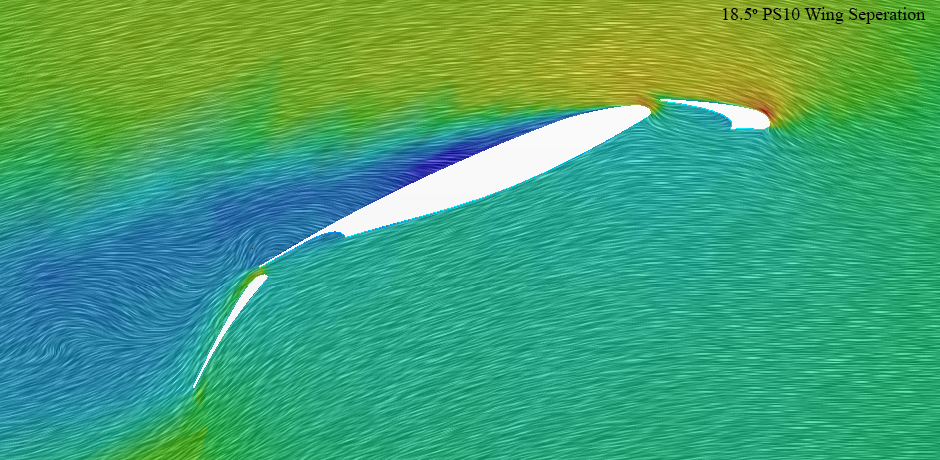
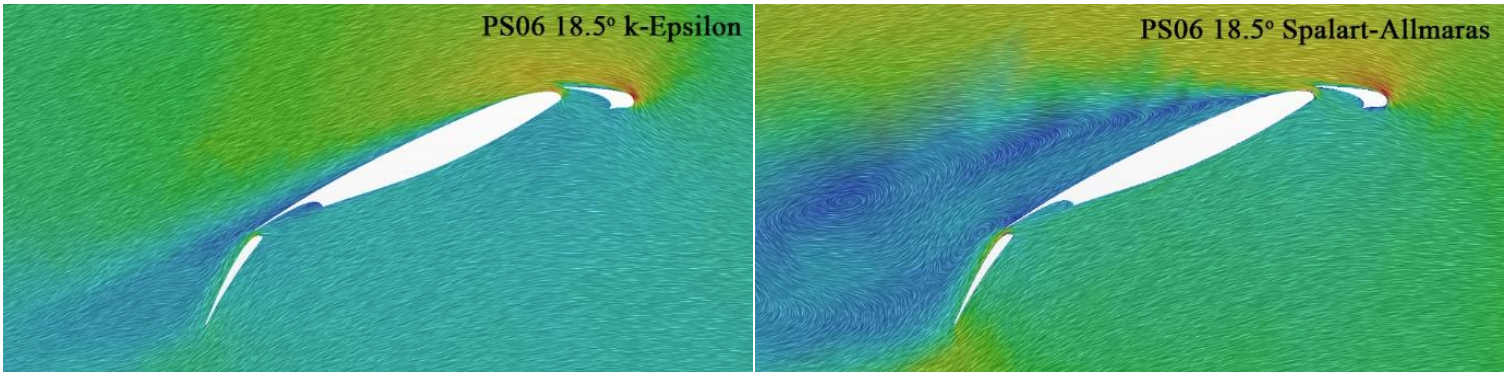
Plots of near wall velocity on the wing show the separated regions clearly:
Conclusions
To conclude, it is difficult to use coarse grids to assess high-lift configuration aircraft performance using a RANS turbulence approach with confidence. This is especially true at high angles of attack, closer to stall.
Future Work
It would be interesting to revisit this study in future with more compute resources. A finer mesh and a more appropriate approach to turbulence and wall modelling may yield greatly improved results!